Class 7 Maths Chapter (Part II) 5 : Connecting the Dots | Statistics, Mean, Median, Mode, Range & Data Handling
Complete Chapter 5 (Part II) guide: introduction to statistical questions and statements, calculating representative values like Arithmetic Mean (Average), Median (middle value), Mode (most frequent value) and Range (difference between max and min), understanding 'fair-share' concept of mean, choosing the right measure of central tendency for different situations (outliers effect), plus solved examples from cricket scores, rainfall data, and garden flowers for CBSE Class 7 Maths
Updated: 6 months ago
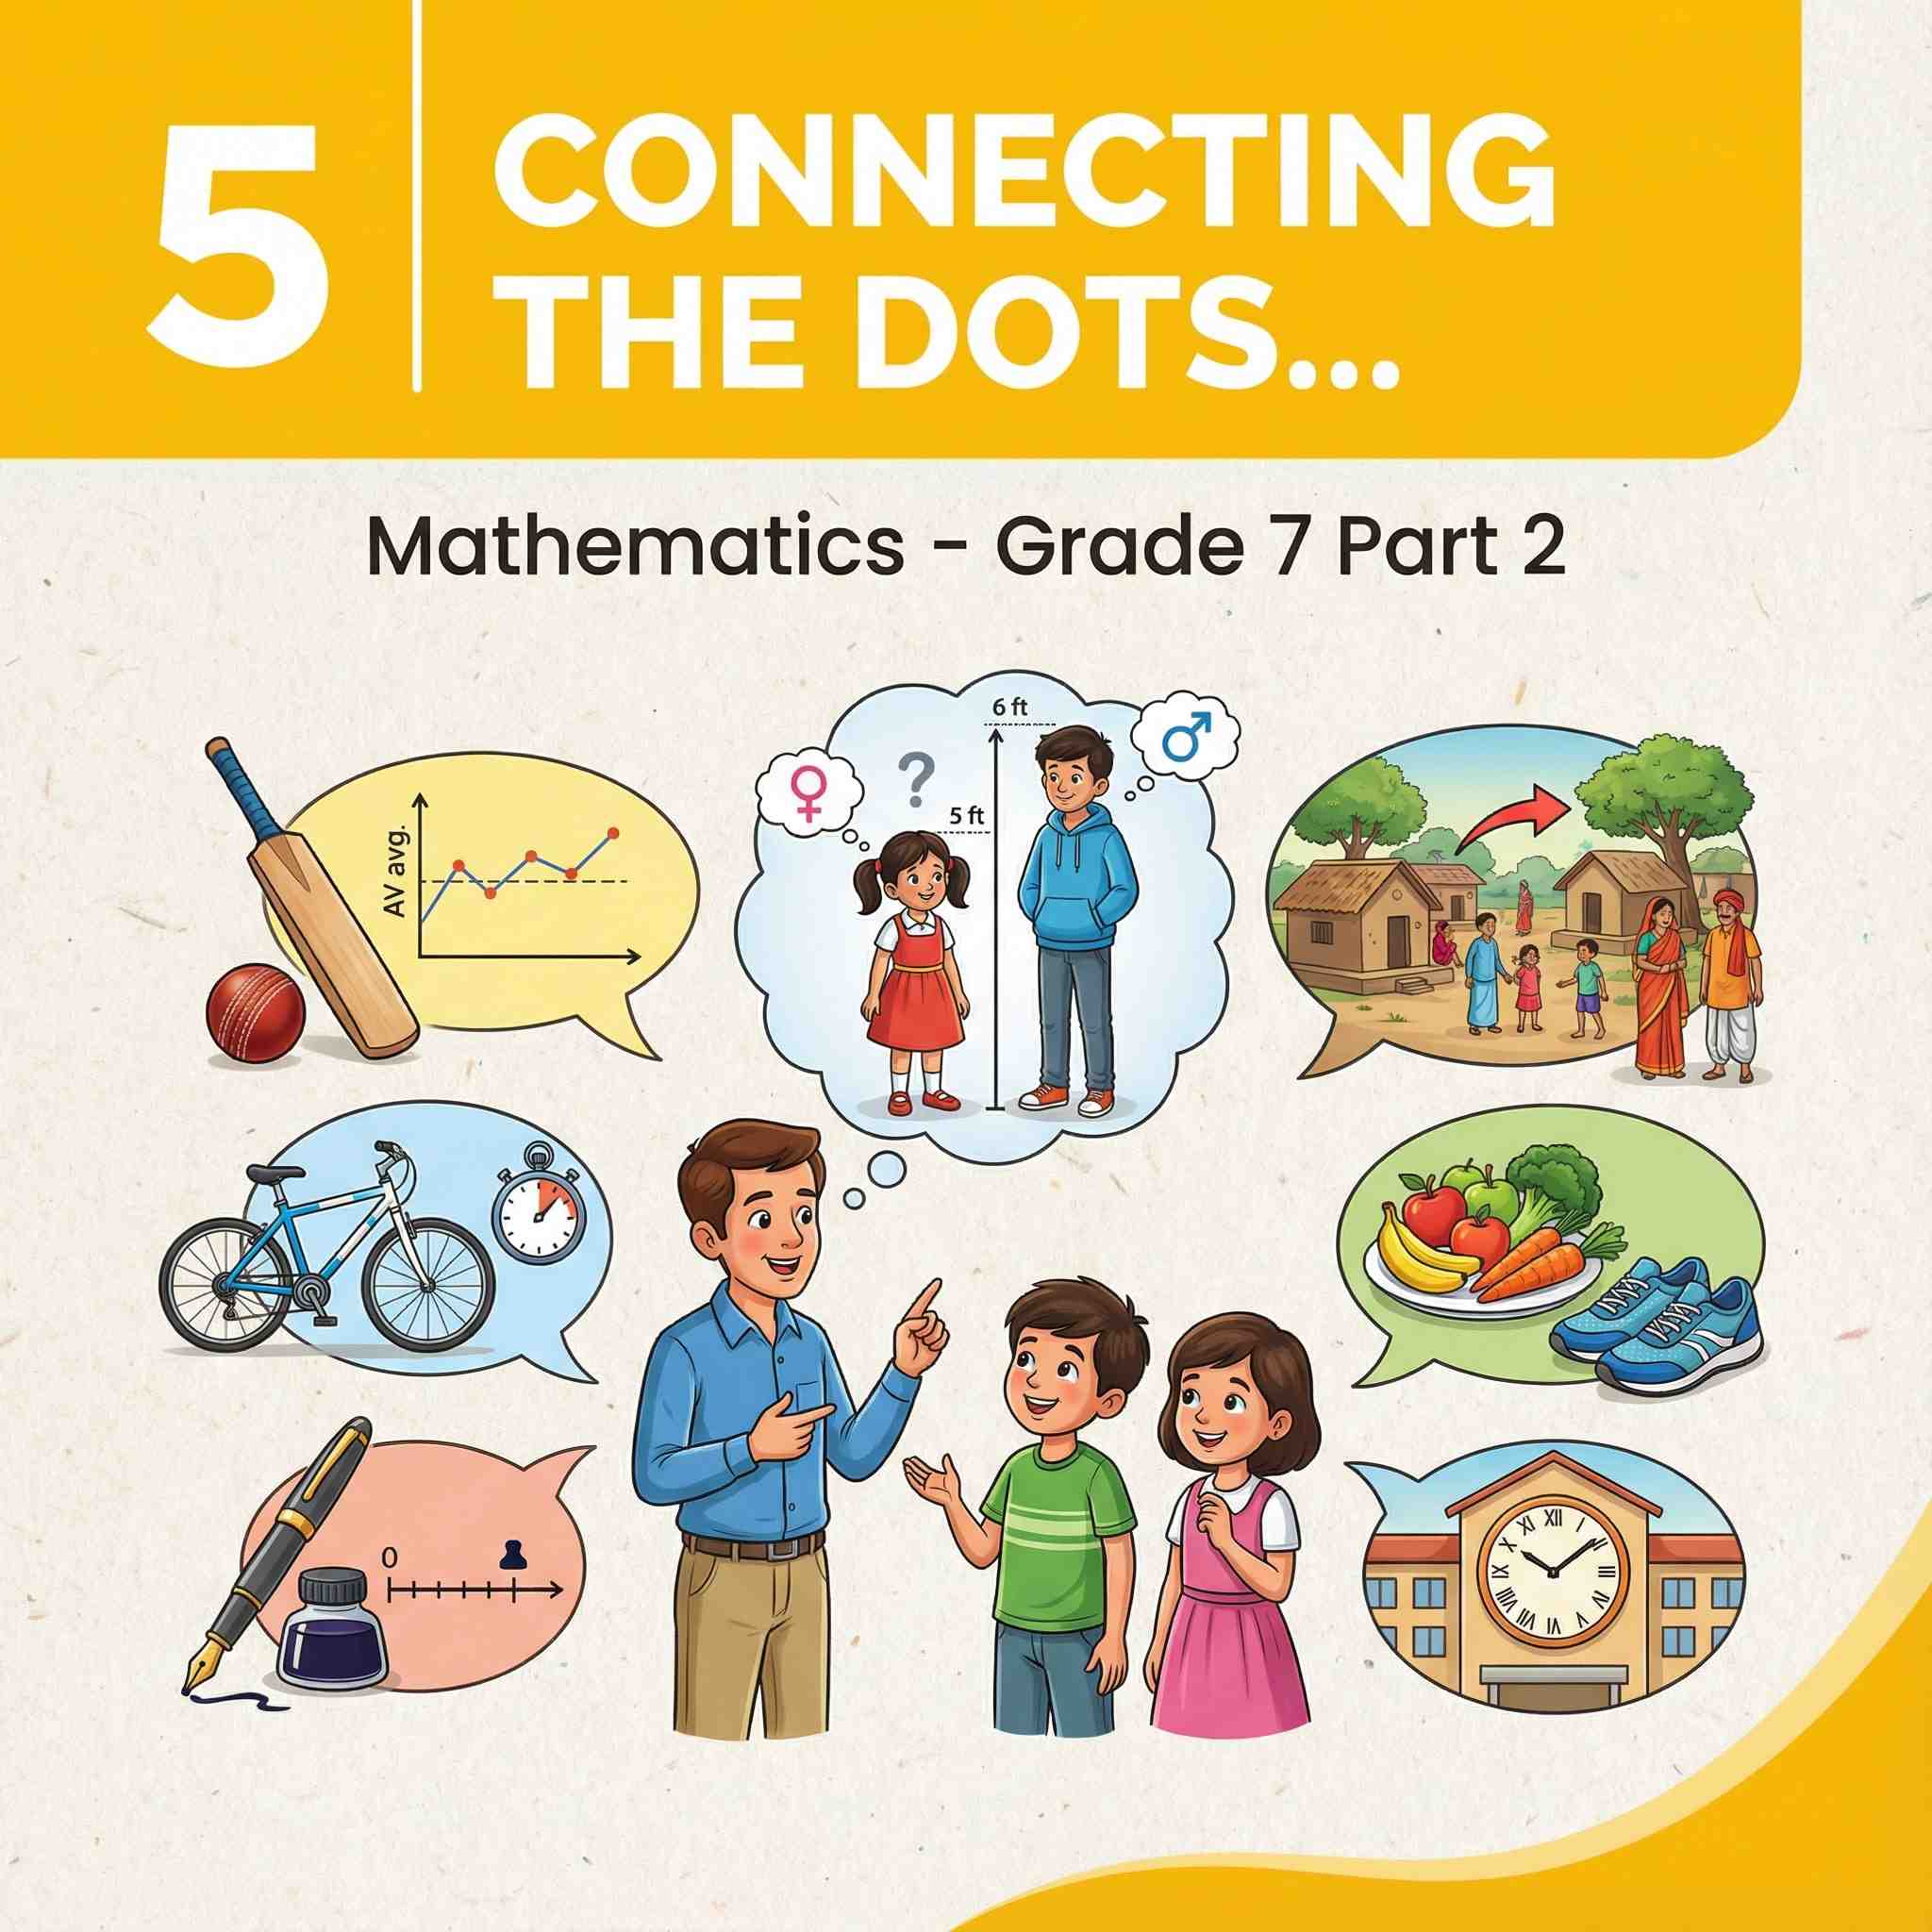
Connecting the Dots...
Class 7 Mathematics Chapter 5 | Complete Guide | Statistics 2025
Chapter at a Glance – Connecting the Dots
This chapter introduces statistical thinking, questions, statements, and representative values like mean, using examples from cricket, fruits, flowers, and onion prices.
Main Topics Covered
- Statistical questions and statements
- Representative values: Mean (average)
- Fair-share interpretation of average
- Comparing data sets using totals, averages, max/min
- Visualizing data with dot plots
- Averages in real life
- Outliers and medians
Key Takeaways for Exams
Statistical Question
Anticipates variability, requires data collection.
Mean Formula
Sum of values ÷ Number of values.
Fair-Share
Average as equal distribution.
Dot Plot
Visualizes data distribution and variability.
Outliers
Extreme values affecting mean; use median.
Data Comparison
Use min, max, range, average, total.


As an Amazon Associate, ProSyllabus earns from qualifying purchases. Prices shown are subject to change.
Test your CBSE Class 7 Annual Assessment prep
Quizzes
10 questions · ~10 minutes · instant rank & AI diagnosis
Integers and Rational Numbers Fundamentals | CBSE Class 7 Annual Assessment
Class 7 Social Science — Banks and the Magic of Finance (Practice Quiz)
Class 7 Social Science — Infrastructure: Engine of India's Development (Practice Quiz)
Class 7 Social Science — The State, the Government, and You (Practice Quiz)
Class 7 Social Science — India, a Home to Many (Practice Quiz)
Class 7 Social Science — Turning Tides: 11th and 12th Centuries (Practice Quiz)
Class 7 Social Science — Empires and Kingdoms: 6th to 10th Centuries (Practice Quiz)
Class 7 Social Science — India and Her Neighbours (Practice Quiz)
Class 7 Social Science — The Story of Indian Farming (Practice Quiz)
Class 7 Social Science — Understanding Markets (Practice Quiz)
Class 7 Social Science — From Barter to Money (Practice Quiz)
Class 7 Social Science — The Constitution of India — An Introduction (Practice Quiz)
Class 7 Social Science — From the Rulers to the Ruled: Types of Governments (Practice Quiz)
Class 7 Social Science — How the Land Becomes Sacred (Practice Quiz)
Class 7 Social Science — The Gupta Era: An Age of Tireless Creativity (Practice Quiz)
Class 7 Social Science — The Age of Reorganisation (Practice Quiz)
Class 7 Social Science — The Rise of Empires (Practice Quiz)
Class 7 Social Science — New Beginnings: Cities and States (Practice Quiz)
Class 7 Social Science — Climates of India (Practice Quiz)
Class 7 Social Science — Understanding the Weather (Practice Quiz)
Class 7 Social Science — Geographical Diversity of India (Practice Quiz)
Class 7 Sanskrit — परिशिष्टम् २ — धातुरूपाणि एवं सन्धि-परिचयः (Practice Quiz)
Class 7 Sanskrit — परिशिष्टम् १ — शब्दरूपाणि (Practice Quiz)
Class 7 Sanskrit — वर्णमात्रा-परिचयः (Practice Quiz)
Class 7 Sanskrit — वीराङ्गना पन्नाधाया (Practice Quiz)
Class 7 Sanskrit — द्वीपेषु रम्यः द्वीपोऽण्डमानः (Practice Quiz)
Class 7 Sanskrit — दशमः कः? (Practice Quiz)
Class 7 Sanskrit — अन्नाद् भवन्ति भूतानि (Practice Quiz)
Class 7 Sanskrit — हितं मनोहारि च दुर्लभं वचः (Practice Quiz)
Class 7 Sanskrit — ईशावास्यम् इदं सर्वम् (Practice Quiz)
Class 7 Sanskrit — क्रीडाम वयं श्लोकान्त्याक्षरीम् (Practice Quiz)
Class 7 Sanskrit — सेवा हि परमो धर्मः (Practice Quiz)
Class 7 Sanskrit — न लभ्यते चेत् आम्लं द्राक्षाफलम् (Practice Quiz)
Class 7 Sanskrit — मित्राय नमः (Practice Quiz)
Class 7 Sanskrit — नित्यं पिबामः सुभाषितरसम् (Practice Quiz)
Class 7 Sanskrit — वन्दे भारतमातरम् (Practice Quiz)
Class 7 Hindi — मीरा के पद (Practice Quiz)
Class 7 Hindi — चिड़िया (Practice Quiz)
Class 7 Hindi — बिरजू महाराज से साक्षात्कार (Practice Quiz)
Class 7 Hindi — वर्षा-बहार (Practice Quiz)
Class 7 Hindi — गिरिधर कविराय की कुंडलियाँ (Practice Quiz)
Class 7 Hindi — नहीं होना बीमार (Practice Quiz)
Class 7 Hindi — पानी रे पानी (Practice Quiz)
Class 7 Hindi — फूल और काँटा (Practice Quiz)
Class 7 Hindi — तीन बुद्धिमान (Practice Quiz)
Class 7 Hindi — माँ, कह एक कहानी (Practice Quiz)
Class 7 English — Bravehearts (Practice Quiz)
Class 7 English — Travel and Adventure (Practice Quiz)
Class 7 English — Dreams and Discoveries (Practice Quiz)
Class 7 English — Wit and Humour (Practice Quiz)
Class 7 English — Learning Together (Practice Quiz)
Class 7 Maths — Finding the Unknown (Practice Quiz)
Class 7 Maths — Constructions and Tilings (Practice Quiz)
Class 7 Maths — Connecting the Dots… (Practice Quiz)
Class 7 Maths — Another Peek Beyond the Point (Practice Quiz)
Class 7 Maths — Finding Common Ground (Practice Quiz)
Class 7 Maths — Operations with Integers (Practice Quiz)
Class 7 Maths — Geometric Twins (Practice Quiz)
Class 7 Maths — Working with Fractions (Practice Quiz)
Class 7 Maths — A Tale of Three Intersecting Lines (Practice Quiz)
Class 7 Maths — Number Play (Practice Quiz)
Class 7 Maths — Parallel and Intersecting Lines (Practice Quiz)
Class 7 Maths — Expressions Using Letter-Numbers (Practice Quiz)
Class 7 Maths — A Peek Beyond the Point (Practice Quiz)
Class 7 Maths — Arithmetic Expressions (Practice Quiz)
Class 7 Maths — Large Numbers Around Us (Practice Quiz)
Class 7 Science — Earth, Moon, and the Sun (Practice Quiz)
Class 7 Science — Light: Shadows and Reflections (Practice Quiz)
Class 7 Science — Life Processes in Plants (Practice Quiz)
Class 7 Science — Life Processes in Animals (Practice Quiz)
Class 7 Science — Measurement of Time and Motion (Practice Quiz)
Class 7 Science — Heat Transfer in Nature (Practice Quiz)
Class 7 Science — Adolescence: A Stage of Growth and Change (Practice Quiz)
Class 7 Science — Changes Around Us: Physical and Chemical (Practice Quiz)
Class 7 Science — The World of Metals and Non-metals (Practice Quiz)
Class 7 Science — Electricity: Circuits and their Components (Practice Quiz)
Class 7 Science — Exploring Substances: Acidic, Basic, and Neutral (Practice Quiz)
Class 7 Science — The Ever-Evolving World of Science (Practice Quiz)
Simple Equations and Applications Practice Quiz | CBSE Class 7 Annual Assessment
Visualising Solid Shapes Advanced Challenge | CBSE Class 7 Annual Assessment
Tracing Changes Through Time Fundamentals | CBSE Class 7 Annual Assessment
Nutrition in Plants Fundamentals | CBSE Class 7 Annual Assessment

Group Discussions
No forum posts available.

