Complete Summary, Explanations, and Solutions for Data Handling and Presentation – Ganita Prakash Class VI, Chapter 4 – Pictographs, Bar Graphs, Questions, Answers
Detailed summary and explanation of Chapter 4 'Data Handling and Presentation' from the Ganita Prakash Mathematics textbook for Class VI, covering data collection and organization, tally marks, frequency distribution tables, pictographs with scales, bar graphs (horizontal and vertical), column graphs, infographics, visual data representation techniques, and artistic considerations—along with all NCERT questions, answers, and step-by-step solutions.
Updated: 6 months ago
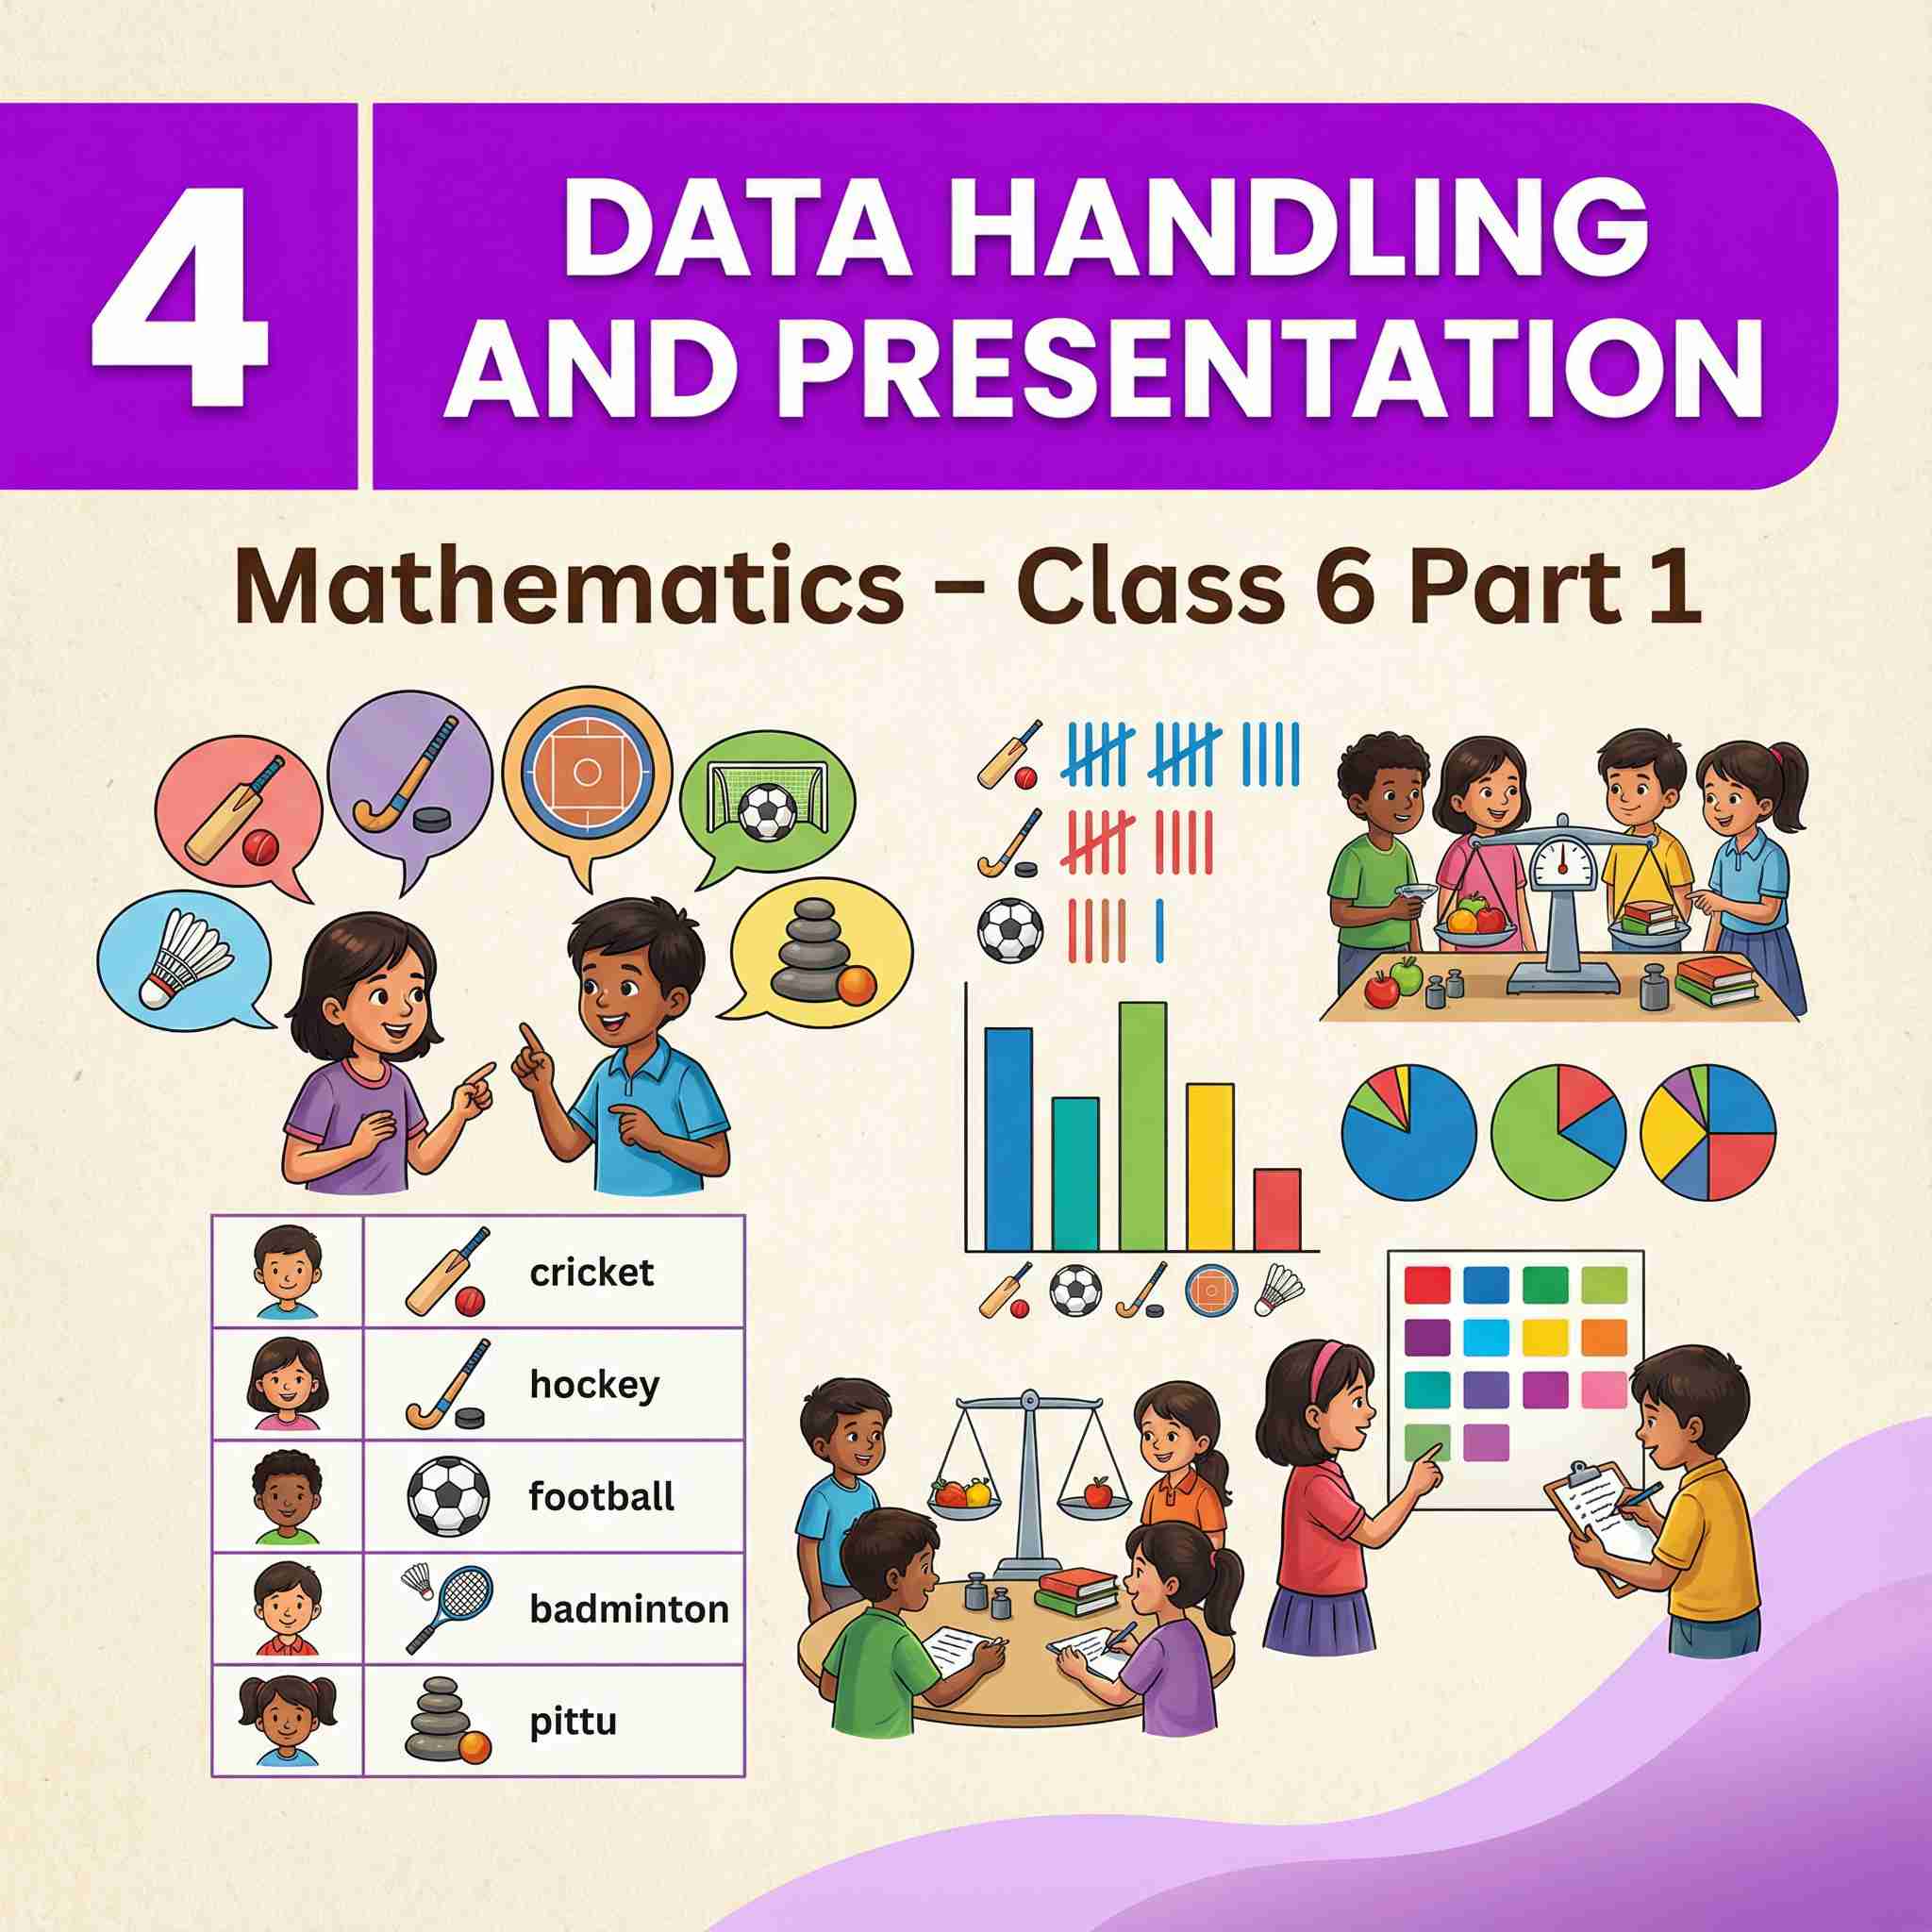
Data Handling and Presentation
NCERT Class 6 Mathematics Chapter 4 | Complete Guide | Data Handling 2025
Chapter at a Glance – Data Handling and Presentation
This chapter explores data as collections of facts, numbers, or observations. It covers collection, organization using tally marks and tables, and presentation via pictographs for quick interpretation.
Main Topics Covered
- Definition and examples of data (colors, weights, games).
- Collecting data: Surveys on favorites, measurements.
- Organizing data: Lists, tally marks, ascending order, frequency tables.
- Pictographs: Visual representation with symbols, scales.
- Interpreting data: Finding most/least, comparisons.
- Challenges: Large data, non-multiples in pictographs.
Key Takeaways for Exams
Data Collection
Surveys, observations; decide if needed (e.g., facts vs. opinions).
Tally Marks
Group in 5s for counting frequencies.
Organization
Ascending/descending, tables for max/min/same.
Pictographs
Symbols represent units; include key/scale.
Interpretation
Quick glance for most/least, totals.
Applications
Games, sweets, shoes, trees, letters.
Sample Tally Mark Diagram


As an Amazon Associate, ProSyllabus earns from qualifying purchases. Prices shown are subject to change.
Test your CBSE Class 6 Annual Assessment prep
Quizzes
10 questions · ~10 minutes · instant rank & AI diagnosis
Class 6 Hindi — हिंद महासागर में छोटा-सा हिंदुस्तान (Practice Quiz)
Whole Numbers Operations Fundamentals | CBSE Class 6 Annual Assessment
Class 6 Social Science — Economic Activities Around Us (Practice Quiz)
Class 6 Social Science — The Value of Work (Practice Quiz)
Class 6 Social Science — Grassroots Democracy – Part 3: Local Government in Urban Areas (Practice Quiz)
Class 6 Social Science — Grassroots Democracy – Part 2: Local Government in Rural Areas (Practice Quiz)
Class 6 Social Science — Grassroots Democracy – Part 1: Governance (Practice Quiz)
Class 6 Social Science — Family and Community (Practice Quiz)
Class 6 Social Science — Unity in Diversity, or 'Many in the One' (Practice Quiz)
Class 6 Social Science — India's Cultural Roots (Practice Quiz)
Class 6 Social Science — The Beginnings of Indian Civilisation (Practice Quiz)
Class 6 Social Science — India, That Is Bharat (Practice Quiz)
Class 6 Social Science — Timeline and Sources of History (Practice Quiz)
Class 6 Social Science — Landforms and Life (Practice Quiz)
Class 6 Social Science — Oceans and Continents (Practice Quiz)
Class 6 Social Science — Locating Places on the Earth (Practice Quiz)
Class 6 Sanskrit — वृक्षाः सत्पुरुषाः इव (Practice Quiz)
Class 6 Sanskrit — माधवस्य प्रियम् अङ्गम् (Practice Quiz)
Class 6 Sanskrit — आलस्यं हि मनुष्याणां शरीरस्थः महान् रिपुः (Practice Quiz)
Class 6 Sanskrit — पृथिव्यां त्रीणि रत्नानि (Practice Quiz)
Class 6 Sanskrit — त्वम् आपणं गच्छ (Practice Quiz)
Class 6 Sanskrit — यः जानाति सः पण्डितः (Practice Quiz)
Class 6 Sanskrit — बुद्धिः सर्वार्थसाधिका (Practice Quiz)
Class 6 Sanskrit — अतिथिदेवो भव (Practice Quiz)
Class 6 Sanskrit — सः एव महान् चित्रकारः (Practice Quiz)
Class 6 Sanskrit — शूराः वयं धीराः वयम् (Practice Quiz)
Class 6 Sanskrit — अहं प्रातः उत्तिष्ठामि (Practice Quiz)
Class 6 Sanskrit — संख्यागणना ननु सरला (Practice Quiz)
Class 6 Sanskrit — अहं च त्वं च (Practice Quiz)
Class 6 Sanskrit — एषः कः? एषा का? एतत् किम्? (Practice Quiz)
Class 6 Sanskrit — संयुक्तव्यञ्जनानि (Practice Quiz)
Class 6 Sanskrit — वयं वर्णमालां पठामः (Practice Quiz)
Class 6 Hindi — पेड़ की बात (Practice Quiz)
Class 6 Hindi — चेतक की वीरता (Practice Quiz)
Class 6 Hindi — परीक्षा (Practice Quiz)
Class 6 Hindi — मैया मैं नहिं माखन खायो (Practice Quiz)
Class 6 Hindi — सत्रिया और बिहू नृत्य (Practice Quiz)
Class 6 Hindi — जलाते चलो (Practice Quiz)
Class 6 Hindi — मेरी माँ (Practice Quiz)
Class 6 Hindi — रहीम के दोहे (Practice Quiz)
Class 6 Hindi — हार की जीत (Practice Quiz)
Class 6 Hindi — पहली बूँद (Practice Quiz)
Class 6 Hindi — गोल (Practice Quiz)
Class 6 Hindi — मातृभूमि (Practice Quiz)
Class 6 English — Culture and Tradition (Practice Quiz)
Class 6 English — Sports and Wellness (Practice Quiz)
Class 6 English — Nurturing Nature (Practice Quiz)
Class 6 English — Friendship (Practice Quiz)
Class 6 English — Fables and Folk Tales (Practice Quiz)
Class 6 Maths — The Other Side of Zero (Practice Quiz)
Class 6 Maths — Symmetry (Practice Quiz)
Class 6 Maths — Playing with Constructions (Practice Quiz)
Class 6 Maths — Fractions (Practice Quiz)
Class 6 Maths — Perimeter and Area (Practice Quiz)
Class 6 Maths — Prime Time (Practice Quiz)
Class 6 Maths — Data Handling and Presentation (Practice Quiz)
Class 6 Maths — Number Play (Practice Quiz)
Class 6 Maths — Lines and Angles (Practice Quiz)
Class 6 Maths — Patterns in Mathematics (Practice Quiz)
Class 6 Science — Beyond Earth (Practice Quiz)
Class 6 Science — Nature's Treasures (Practice Quiz)
Class 6 Science — Living Creatures: Exploring their Characteristics (Practice Quiz)
Class 6 Science — Methods of Separation in Everyday Life (Practice Quiz)
Class 6 Science — A Journey through States of Water (Practice Quiz)
Class 6 Science — Temperature and its Measurement (Practice Quiz)
Class 6 Science — Materials Around Us (Practice Quiz)
Class 6 Science — Measurement of Length and Motion (Practice Quiz)
Class 6 Science — Exploring Magnets (Practice Quiz)
Class 6 Science — Mindful Eating: A Path to a Healthy Body (Practice Quiz)
Class 6 Science — Diversity in the Living World (Practice Quiz)
Class 6 Science — The Wonderful World of Science (Practice Quiz)
Understanding Nouns and Pronouns Fundamentals | CBSE Class 6 Annual Assessment
Parts of a Plant Fundamentals | CBSE Class 6 Annual Assessment
Group Discussions
No forum posts available.

